| Entries |
| A |
|
Armour Square
|
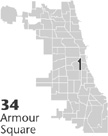
 Community Area 34, 3 miles S of the Loop. The Armour Square Community Area illustrates the difference between a neighborhood and a
community area.
This long thin area (an assemblage of leftovers from adjacent community areas, 21 blocks long, 4–5 blocks wide) is wedged between rail lines,
expressways,
and the South Branch of the
Chicago River.
It contains three distinct neighborhoods.
African Americans
dominate the population to the south; the middle section holds recently arrived Hispanics; and along with a few
Italians
and blacks,
Chinatown
fills the northern section.
Armour Square has been, from the beginning, principally a working-class area. Germans and Irish arrived during the Civil War, and later, Swedes joined the population. These groups used the area as a way station as they moved southward and climbed upward in social and economic status. Armour Square lay south of the burned area during the Chicago Fire of 1871 but was nonetheless greatly affected by the disaster. Laws enacted after the fire required brick or stone construction in the central city. The resulting increase in costs drove many working families out to the edge of the “brick area,” and Armour Square received many such families. Armour Square subsequently lost blocks of housing as the tracks of bordering railroads were elevated. These changes cut off the area from neighborhoods to the east and west.
By 1899, Italian immigrants arrived and formed the Roman Catholic parish of Santa Maria Incoronata. Commercial operations began to displace housing in the area. Some of the encroaching businesses were extensions of the notorious Levee district just to the east. In 1909, Charles Comiskey built a new baseball park for the Chicago White Sox between 34th and 35th Streets. The old Sox park then became home to the American Giants of the Negro League. In 1991 the White Sox moved into a still newer stadium just south of the old Comiskey Park; the Negro Leagues having long since vanished.

|
As the city's “ Black Belt ” began to expand during World War I, African Americans moved into Armour Square's southern section, numbering about 4,000 by 1930. This figure remained stable through the Great Depression and World War II until, in 1947, the Chicago Housing Authority completed Wentworth Gardens at 37th and Princeton, and the neighborhood reached an all-time high population of over 23,000, with blacks making up nearly half the total. Later, widespread demolition made way for construction of the Dan Ryan and Stevenson Expressways and their interconnecting ramps, which set off a continuing decline in population.
In 1999, Chinese constituted over half the area's population. The Chinese were moving west into Bridgeport and a rejuvenated Chinatown continued as a major tourist attraction with many shops and famed restaurants. An outside investor from Hong Kong developed Appleville apartments, and a consortium of Chinese businessmen and local banks developed Chinatown Square and Jade City apartments. A new Chinatown Park was under construction along the river. Adaptive reuse of old structures, nearby infill housing, and the recently enlarged McCormick Place to the east added energy to the area.
| Armour Square (CA 34) | |||||
| Year |
Total
(and by category) |
Foreign Born | Native with foreign parentage | Males per 100 females | |
| 1930 | 21,450 | 25.0% | 37.1% | 122 | |
| 15,207 | White (70.9%) | ||||
| 4,058 | Negro (18.9%) | ||||
| 2,185 | Other (10.2%) | ||||
| 1960 | 15,783 | 14.1% | 22.1% | 103 | |
| 9,096 | White (57.6%) | ||||
| 4,960 | Negro (31.4%) | ||||
| 1,727 | Other races (10.9%) | ||||
| 1990 | 10,801 | 44.6% | — | 90 | |
| 2,505 | White (23.2%) | ||||
| 2,408 | Black (22.3%) | ||||
| 5,616 | Asian/Pacific Islander (52.0%) | ||||
| 272 | Other race (2.5%) | ||||
| 471 | Hispanic Origin* (4.4%) | ||||
| 2000 | 12,032 | 52.0% | — | 90 | |
| 2,287 | White alone (19.0%) | ||||
| 2,053 | Black or African American alone (17.1%) | ||||
| 31 | American Indian and Alaska Native alone (0.3%) | ||||
| 7,324 | Asian alone (60.9%) | ||||
| 2 | Native Hawaiian and Other Pacific Islander alone (0.0%) | ||||
| 142 | Some other race alone (1.2%) | ||||
| 193 | Two or more races (1.6%) | ||||
| 448 | Hispanic or Latino* (3.7%) | ||||
The Encyclopedia of Chicago © 2004 The Newberry Library. All Rights Reserved. Portions are copyrighted by other institutions and individuals. Additional information on copyright and permissions.