| Entries |
| E |
|
East Chicago, IN
|
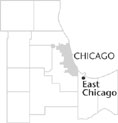 Lake County, 19 miles SE of the Loop. East Chicago became a leading industrial center by capitalizing on the resources of its metropolitan namesake and its proximity to
Lake Michigan
and the
Calumet River.
Mills and factory jobs drew tens of thousands of migrants to the region in the 1910s and 1920s. The town grew to the fringes of
Whiting,
Hammond,
and
Gary,
eventually covering more than 12 square miles.
Lake County, 19 miles SE of the Loop. East Chicago became a leading industrial center by capitalizing on the resources of its metropolitan namesake and its proximity to
Lake Michigan
and the
Calumet River.
Mills and factory jobs drew tens of thousands of migrants to the region in the 1910s and 1920s. The town grew to the fringes of
Whiting,
Hammond,
and
Gary,
eventually covering more than 12 square miles.
The Potawatomi hunted East Chicago's white pine and oak forests and fished its grassy riverways. In 1854, George W. Clark, a farsighted civil engineer connected with railroads, began accumulating land along Lake Michigan. In 1881 a British investment firm bought a parcel of Clark's land, and platting of the subdivision of East Chicago began in 1888. That same year, the Chicago & Calumet Terminal Beltline (later the Baltimore & Ohio Railroad) linked the settlement to Chicago's trunk rail system. East Chicago incorporated as a town in 1889, and reincorporated as a city in 1893.
After 1901 two events transformed the city's fortunes. First, Inland Steel built a plant at Indiana Harbor, heralding the dawn of East Chicago as an industrial center. Second, in 1903 the East Chicago Company (ECC) took direct control of residential and municipal planning.
The ECC represented Chicago powerbrokers, including Potter Palmer, Jr., and Stanley McCormick. They recognized the need for a new industrial zone outside Chicago and invested heavily in municipal services, oversaw neighborhood planning, and dredged the Indiana Harbor Ship Canal. By 1907, East Chicago boasted a navigable waterway link to Lake Michigan and to the Grand Calumet River.
Enormous freighters, thousands of railcars, and massive pipelines eventually supplied coal, iron ore, limestone, oil, and other materials from around the nation for processing. Steel mills, petroleum refineries, construction, manufacturing, and chemical factories operated at Indiana Harbor and along its inner canal system.
With immigrants from Eastern and Southern Europe flocking to its factory jobs, the population of East Chicago soared 460 percent between 1900 and 1910, from 3,411 to 19,098. Over 50 percent of the population were not native born. During World War I, African Americans from the South, and Mexicans from the Southwest and Mexico, joined the industrial labor force, lifting the population to 54,784 by 1930.
A rivalry developed between Indiana Harbor, the “East Side” home of Inland Steel and most working-class families, and East Chicago's “West Side,” the residential enclave of the native-born business community. Locals spoke of the “Twin City” to describe spatial, residential, and class divisions at the heart of the town's identity.
In the 1920s, East Chicago carried a reputation as a freewheeling boomtown with a vibrant vice district and underground network of “blind tigers” serving bootleg liquor. In 1930, federal investigators indicted East Chicago mayor Raleigh Hale and police chief James W. Regan for conspiring to violate Prohibition, forcing both men to resign.
Religious practices fostered early community development through ethnic social services and the building of St. Catherine Hospital. By World War II, 59 congregations reflecting the ethnic and cultural diversity of the population worshiped in East Chicago: 33 Protestant, 16 Roman Catholic, 8 Greek Orthodox, and 2 Jewish.
After 1930, city growth slowed with only nominal increases, reaching a peak population of 57,669 in 1960. As East Chicago lost its job base in subsequent decades, population declined, to 32,414 in 2000.
| East Chicago, IN (inc. 1889) | |||||
| Year |
Total
(and by category) |
Foreign Born | Native with foreign parentage | Males per 100 females | |
| 1900 | 3,411 | 39.0% | 42.1% | 130 | |
| 3,408 | White (99.9%) | ||||
| 1 | Negro (0.0%) | ||||
| 2 | Chinese (0.1%) | ||||
| 1930 | 54,784 | 25.2% | 34.7% | 127 | |
| 44,308 | White (80.9%) | ||||
| 5,088 | Negro (9.3%) | ||||
| 7 | Indian (0.0%) | ||||
| 30 | Chinese (0.1%) | ||||
| 5,343 | Mexican (9.8%) | ||||
| 8 | Other (0.0%) | ||||
| 1960 | 57,669 | 15.4% | 22.6% | 107 | |
| 43,831 | White (76.0%) | ||||
| 13,766 | Negro (23.9%) | ||||
| 72 | Other races (0.1%) | ||||
| 1990 | 33,892 | 11.6% | — | 91 | |
| 12,936 | White (38.2%) | ||||
| 11,395 | Black (33.6%) | ||||
| 102 | American Indian (0.3%) | ||||
| 33 | Asian/Pacific Islander (0.1%) | ||||
| 9,426 | Other race (27.8%) | ||||
| 15,889 | Hispanic Origin* (46.9%) | ||||
| 2000 | 32,414 | 14.7% | — | 92 | |
| 11,843 | White alone (36.5%) | ||||
| 11,695 | Black or African American alone (36.1%) | ||||
| 166 | American Indian and Alaska Native alone (0.5%) | ||||
| 66 | Asian alone (0.2%) | ||||
| 26 | Native Hawaiian and Other Pacific Islander alone (0.1%) | ||||
| 7,774 | Some other race alone (24.0%) | ||||
| 844 | Two or more races (2.6%) | ||||
| 16,728 | Hispanic or Latino* (51.6%) | ||||
The Encyclopedia of Chicago © 2004 The Newberry Library. All Rights Reserved. Portions are copyrighted by other institutions and individuals. Additional information on copyright and permissions.