| Entries |
| W |
|
West Englewood
|
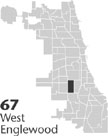 Community Area 67, 8 miles SW of the Loop. West Englewood was swamp and oak savanna when white settlers first came to the area in the late 1840s. These homesteaders were predominately
German
and
Swedish
farmers. Development followed as
railroads
began crisscrossing the area. In February 1852 the Michigan Southern & Northern Indiana Railroad began rail service to the region. The Rock Island Railroad and the Wabash Railroad also laid track in the area by the close of the 1850s. The rail stop and the adjacent area of railroad switch tracks, junctions, and scattered farms became known as Chicago Junction, and later Junction Grove. New residents arrived following job opportunities with the railroads and the Chicago stockyards just to the north of the district. These workers, mostly
Irish
and German immigrants, lived in the area of Junction Avenue, now 63rd Street, from Indiana Avenue to Halsted Street. Farther west, a small
African American
population was located at 63rd Street and Loomis Boulevard.
Community Area 67, 8 miles SW of the Loop. West Englewood was swamp and oak savanna when white settlers first came to the area in the late 1840s. These homesteaders were predominately
German
and
Swedish
farmers. Development followed as
railroads
began crisscrossing the area. In February 1852 the Michigan Southern & Northern Indiana Railroad began rail service to the region. The Rock Island Railroad and the Wabash Railroad also laid track in the area by the close of the 1850s. The rail stop and the adjacent area of railroad switch tracks, junctions, and scattered farms became known as Chicago Junction, and later Junction Grove. New residents arrived following job opportunities with the railroads and the Chicago stockyards just to the north of the district. These workers, mostly
Irish
and German immigrants, lived in the area of Junction Avenue, now 63rd Street, from Indiana Avenue to Halsted Street. Farther west, a small
African American
population was located at 63rd Street and Loomis Boulevard.
In 1865, Junction Grove became part of the incorporated town of Lake. In 1868, Henry B. Lewis, a wool merchant on South Water Street, and a member of both the Cook County and Town of Lake boards of education, suggested the name of Englewood (after Englewood, New Jersey), since the area was heavily wooded. Displaced survivors of the Chicago Fire of 1871 and others seeking to escape urban congestion prompted a slow building boom in an area that became known as West Englewood in the early 1870s. Chicago annexed the area in 1889, and by 1896 streetcars connected the community to downtown Chicago. During this time sidewalks were built, single-family frame houses were constructed, and in 1907, the Englewood branch of the “ L ” was extended into West Englewood to Loomis Boulevard.
The aftermath of World War I saw an influx of Italian immigrants to West Englewood. The railroads and stockyards continued to be important employers, and residents had the employment opportunities of the entire city only a local train ride away. A transit bus barn at the corner of 74th and Ashland became a leading employer in the area. The community's commercial and retail strip ran along 63rd and Ashland Avenue south to 75th street.
By 1920 the community totaled 53,276; Germans, Irish, and Italians were most numerous among the foreign-born. In the 1930s the population of West Englewood continued to grow as more African Americans moved into the area, an influx that accelerated in the 1940s and 1950s with migrants from the rural South. The greatest demographic shift occurred between 1970 and 1980, when the African American population increased from 48 to 98 percent.
The 1970s saw the decline of West Englewood's economic prosperity. The closing of the Chicago Transit Authority bus barn and the loss of stockyard and railroad jobs hit the community hard. For the first time since its founding, West Englewood population declined, after peaking at 62,069 in 1980. Many residents followed jobs to the suburbs. In 1990, West Englewood's population was 52,772, 98 percent African American. Behind the outward bleakness of closed retail shops and gang graffiti, only 14 percent of the population had an income of $50,000 or more, and little more than a quarter of the residents had high-school educations.
Under Mayor Harold Washington's administration, many abandoned homes and vacant buildings were demolished, and repairs were made on sewage lines and major streets. The West Englewood United Organization was organized by three area churches to provide financial and advisory assistance to homeowners in the community and to provide summer programs for neighborhood children. In addition, Neighborhood Housing Services, a national network of neighborhood improvement programs, began to address some of the problems of the community.
West Englewood is home to the highly rated Lindblom Technical High School, known for its massive neoclassical facade.
| West Englewood (CA 67) | |||||
| Year |
Total
(and by category) |
Foreign Born | Native with foreign parentage | Males per 100 females | |
| 1930 | 63,845 | 22.9% | 43.0% | 102 | |
| 61,854 | White (96.9%) | ||||
| 1,967 | Negro (3.1%) | ||||
| 24 | Other (0.0%) | ||||
| 1960 | 58,516 | 11.6% | 26.4% | 94 | |
| 51,583 | White (88.2%) | ||||
| 6,842 | Negro (11.7%) | ||||
| 91 | Other races (0.2%) | ||||
| 1990 | 52,772 | 0.8% | — | 88 | |
| 706 | White (1.3%) | ||||
| 51,762 | Black (98.1%) | ||||
| 100 | American Indian (0.2%) | ||||
| 37 | Asian/Pacific Islander (0.1%) | ||||
| 167 | Other race (0.3%) | ||||
| 331 | Hispanic Origin* (0.6%) | ||||
| 2000 | 45,282 | 1.0% | — | 86 | |
| 278 | White alone (0.6%) | ||||
| 44,429 | Black or African American alone (98.1%) | ||||
| 48 | American Indian and Alaska Native alone (0.1%) | ||||
| 30 | Asian alone (0.1%) | ||||
| 3 | Native Hawaiian and Other Pacific Islander alone (0.0%) | ||||
| 156 | Some other race alone (0.3%) | ||||
| 338 | Two or more races (0.7%) | ||||
| 459 | Hispanic or Latino* (1.0%) | ||||
The Encyclopedia of Chicago © 2004 The Newberry Library. All Rights Reserved. Portions are copyrighted by other institutions and individuals. Additional information on copyright and permissions.