| Entries |
| W |
|
West Town
|
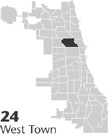 Community Area 24, 3 miles NW of the Loop. Chicago's West Town community area, located on the city's near northwest side, is perhaps best understood as an amalgam of several distinct neighborhoods. With its official boundaries roughly corresponding to Bloomingdale on the north, Kinzie on the south, the
Chicago River's
North Branch to the east, and a shifting western boundary that goes as far as Kedzie, West Town has long sustained a strikingly diverse population mix.
Community Area 24, 3 miles NW of the Loop. Chicago's West Town community area, located on the city's near northwest side, is perhaps best understood as an amalgam of several distinct neighborhoods. With its official boundaries roughly corresponding to Bloomingdale on the north, Kinzie on the south, the
Chicago River's
North Branch to the east, and a shifting western boundary that goes as far as Kedzie, West Town has long sustained a strikingly diverse population mix.
Most of the area east of Wood Street was within the original 1837 city limits. Workers came to the area in the late 1840s to build railroad lines. Other settlers were attracted to factories near the river.
|
In the second half of the twentieth century, West Town became a primarily Latino “port of entry” neighborhood. First, Puerto Ricans moved westward toward Humboldt Park, and then Mexicans concentrated in areas east of the Ukrainian Village. By 1990, Mexicans formed the dominant Latino group. Their presence is reflected in the shopping district along Chicago Avenue, particularly east of Damen. African Americans have settled in the area since the 1930s but became particularly numerous in the 1970s with the construction of the Noble Square Cooperative project as well as other subsidized housing in the vicinity. In the late twentieth century, black artists and other more affluent blacks moved in as part of the overall evolution of Wicker Park as a “hip alternative” area catering to musicians and artists. The African American percentage of the community area population stood at a solid 10 percent during the last two decades of the twentieth century.
At the turn of the twenty-first century, West Town was changing again. The influx of artists, students, and other younger “bohemian” populations drew more affluent residents, particularly in the Bucktown section north of North Avenue. This gentrification subsequently spread to the southeast areas along Milwaukee Avenue and Halsted, with restaurants, nightclubs, and shops near the cultural landmarks and institutions created and sustained by earlier residents. The various Latino groups remained a clear majority into the early 1990s but fell to 47 percent by 2000. Lower-income residents of West Town have moved to areas further north and west to escape the area's rising real-estate values.
| West Town (CA 24) | |||||
| Year |
Total
(and by category) |
Foreign Born | Native with foreign parentage | Males per 100 females | |
| 1930 | 187,292 | 38.6% | 50.3% | 108 | |
| 186,271 | White (99.5%) | ||||
| 841 | Negro (0.4%) | ||||
| 180 | Other (0.1%) | ||||
| 1960 | 139,657 | 24.9% | 25.8% | 104 | |
| 136,479 | White (97.7%) | ||||
| 2,366 | Negro (1.7%) | ||||
| 812 | Other races (0.6%) | ||||
| 1990 | 87,703 | 28.4% | — | 103 | |
| 44,514 | White (50.8%) | ||||
| 9,207 | Black (10.5%) | ||||
| 482 | American Indian (0.5%) | ||||
| 1,157 | Asian/Pacific Islander (1.3%) | ||||
| 31,949 | Other race (36.4%) | ||||
| 54,361 | Hispanic Origin* (62.0%) | ||||
| 2000 | 87,435 | 22.8% | — | 108 | |
| 50,896 | White alone (58.2%) | ||||
| 8,674 | Black or African American alone (9.9%) | ||||
| 446 | American Indian and Alaska Native alone (0.5%) | ||||
| 1,575 | Asian alone (1.8%) | ||||
| 105 | Native Hawaiian and Other Pacific Islander alone (0.1%) | ||||
| 21,676 | Some other race alone (24.8%) | ||||
| 4,063 | Two or more races (4.6%) | ||||
| 40,966 | Hispanic or Latino* (46.9%) | ||||
The Encyclopedia of Chicago © 2004 The Newberry Library. All Rights Reserved. Portions are copyrighted by other institutions and individuals. Additional information on copyright and permissions.